Crossrail’s tunnels under London are long, so long that when they were being planned, they were affected by something you might not expect — the curvature of the earth.
Knowing how the curvature of the earth is going to affect your new tunnels is quite important, otherwise, the tunnels don’t line up when they meet. Worse, in some of the really tight spaces between older tunnels, you can end up drilling right into them. That would be embarrassing.
When the current Crossrail scheme was developed in the 1990s, the planners used maps based on the Ordnance Survey National Grid reference system (BNG), but this turned out to be too crude a measure for the accuracy needed by Crossrail.
It’s not that Crossrail couldn’t have been dug using it, as obviously older tunnels were dug before modern maps, but there would have been risks of misalignment and a lot more time/money would have had to be spent surveying the tunnels to make sure they pointed in the right direction.
In addition, interfaces between Crossrail and existing infrastructure as owned by Network Rail and London Underground would need to fit within tighter modern engineering tolerances.
Had they used normal “street maps”, then Crossrail tunnels could have been seen deviations of up to 20cm per kilometre of tunnel — due to the curvature of the earth. Maybe not a huge issue in some places, but that could have been catastrophic in central London as the Crossrail tunnels squeezed between gaps in other tube lines, sewers and modern foundations.
For example, Tottenham Court Road had a gap so tight that had they not adjusted for the curvature of the earth, the tunnel boring machine that left Paddington would have been sufficiently out of place by the time it arrived, that the cutting head might have drilled through the Northern line tunnels.
So Crossrails’s maps needed to adapt for the curvature of the planet.
How is this possible?
If you’ve ever peeled an orange then tried to lay the peel flat on a surface, you’ll appreciate how difficult it is to represent a curved surface on a sheet of paper – and maps have long had various ways of adjusting their maps to allow for that.
There are numerous mathematical solutions, each with their own way of working out where X marks the spot. Thanks to that, the various different systems of latitude and longitude in common use today can disagree on the coordinates of a location by as much as 200 metres.
If that seems excessive, then pop along to Greenwich and stand on the Prime Meridian, and pull out a GPS receiver. It’ll tell you that you’re 102 meters to the east of the meridian, because it uses a different mapping system to old paper maps.
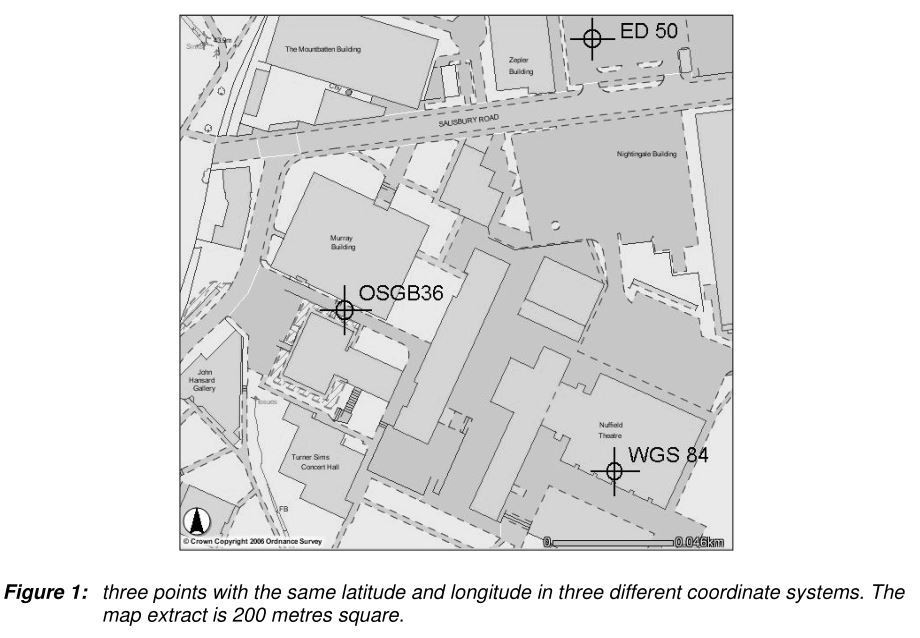
The figure below shows three points that all have the same latitude and longitude, in three different coordinate systems (OSGB36, WGS84 and ED50). Each one of these coordinate systems is widely used and fit for its own unique purpose, and none of them is intrinsically wrong, yet they all disagree about where a specific location on the planet’s surface should be shown on a flat map.
The differences between them are just a result of the fact that any system of ‘absolute coordinates’ is always arbitrary.
When digging a tunnel under London though, such differences are no longer so arbitrary. In fact, they can be critical.
For a project as large as Crossrail, the National Grid’s use of a single scale factor to represent a curved planet on a sheet to account for the distortions was too rough a measurement.
To reduce the scale distortion, Crossrail made use of a customised projection with a meridian that runs through central London. That reduced the scale distortions from an average of 20 cm per kilometer drilled to just 1 mm per kilometer.
This became London Survey Grid (LSG).

This in turn caused another problem in that they now had two different sets of measurement data and conversion rules were developed to ensure that plans based on the British National Grid could be reliably converted into the new more accurate format.
A number of mapping zones were created for Crossrail, each with corrective parameters to help to adjust for the curvature of the ground, which could then be used to translate between the LSG and BNG.
Adoption of the curvature correction ensured that all the design and construction data was created within a real-world context and allowed for a greater ease of interoperability between computer aided design and the mapping systems.
All this was needed because the Crossrail tunnels are long enough to be affected by the curvature of the earth.
It’s also one of the many legacies that Crossrail will leave behind — a more accurate map of London for use by future engineers, maybe building for example, Crossrail 2.
Sources:
Topographical Surveys and Mapping
Surveying for Engineers By J. Uren, W.F. Price
A guide to coordinate systems in Great Britain
Building a Spatial Data Infrastructure for Crossrail
GIS and Information Management on Crossrail C122 Bored Tunnels contract
This article was inspired by the mapping exhibition held by TfL last year.


Very interesting post, thanks!
I suppose when Crossrail 2 is built which will run North to South rather than East to West these problems will arise in a different way .
Why is Clacton mapped so precisely too? Or maybe it’s top secret!
Steering the tbms so accurately was done using lasers I believe. The boring through that tight spot passing over the Northern line bore and under the escalator with only inches to spare was a terrific feat.
Centimeters my friend. Not inches. This modern high precision engineering relies on proper metric measurements not on Victorian inches and feet
Could this also happen to the construction of Crossrail 2.
Great article Ian! As a map geek myself I found this really interesting.
@Jimmy: Presumably because there’s a depot there for CR as well.
Perhaps the Clacton mapping was done to cover the new ground made from the spoil from the tunnelling. It’s round thereabouts I think.
Forgive me, yes not feet and inches. But it’s also centimetres / kilometres etc. not -ers.
It’s possible to set most tech stuff to english English rather than american same in a few steps.
I’ve often wondered how big a building needs to be before curvature of the earth needs to be considered. (Think big warehouse, Boeing plant, suspension bridge, etc.)
The curve of the earth is not 20 cms per kilometre it is 20 cms per kilometer squared, so by the time you’ve covered 117 kimometers (the length of this tunnel) the curve would be almost 1 kilometre. This link shows that 90 miles would have a 1 mile drop. Why is this article telling us it’s 20cms per kilometre? https://steemit.com/flatearth/@flatearthvegan/wikipedia-removes-earth-curvature-chart-from-all-pages